Event studies are complex and developing their algorithms is even more so. EventStudyTools was built to make your research life easier. Our research apps perform all calculations needed for large-scale event studies.
While we have multiple apps for different purposes (e.g., for volume event studies or news analytics), the Abnormal Return Calculator (ARC) is most likely the research app that brought you here.
How to use EST ARC?
In a nutshell:
- ARC requires you to upload three input data files. Thereafter, it calculates all abnormal returns, test statistics, and p-values
- You can use ARC through a graphical user interface (GUI) or our R-package. Most users choose the GUI. You find it here, it looks as follows:
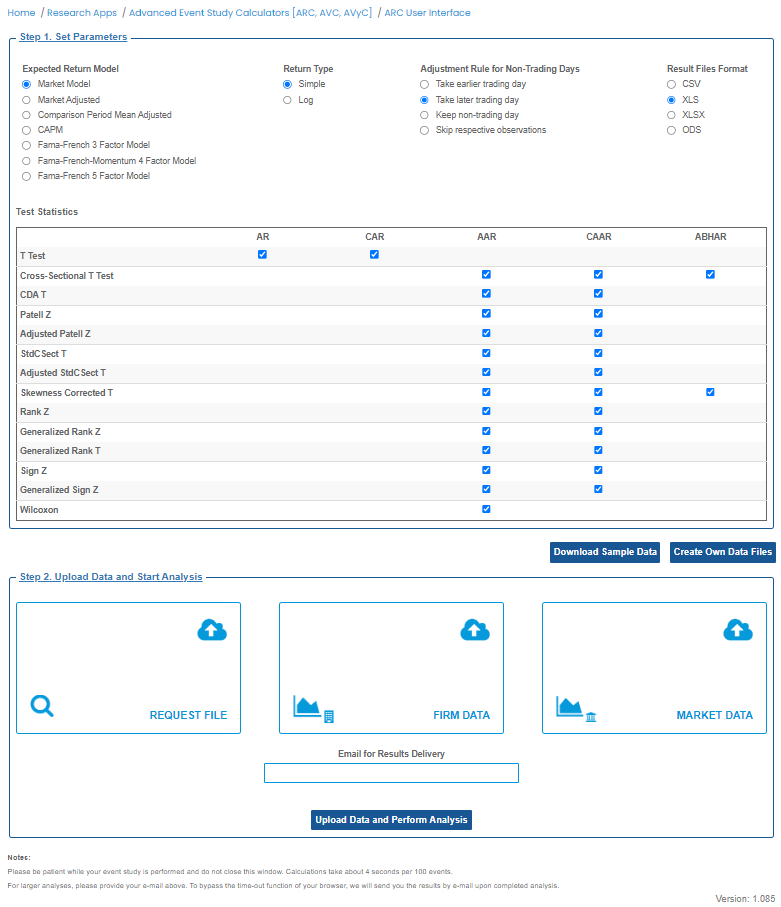
The upper part of the interface lets you choose broad parameters of your event study. The mid-section informs you about the test statistics that will be produced at the different levels of analysis. The lower data upload section lets you upload your input files.
Creating your three input files is the most challenging part of the whole process. Please download first the sample data and review it, ideally in a text editor. Try to understand the data structure with the help of the introduction page.
We added a link to the sample data also on the GUI. Also, you find a link on it to EST's data compilation (DC) service. With the request file only, DC will compile for you the firm and market files.
Once you created your own input files, you can lay back and let ARC do the rest of the work. It processes your input data and sends you the results of your event study to your e-mail address. Also, it prompts the results on the GUI in case you can't access your emails.
If you would like a more comprehensive intro, please read our article on Medium - or get it read out aloud to you by Medium.